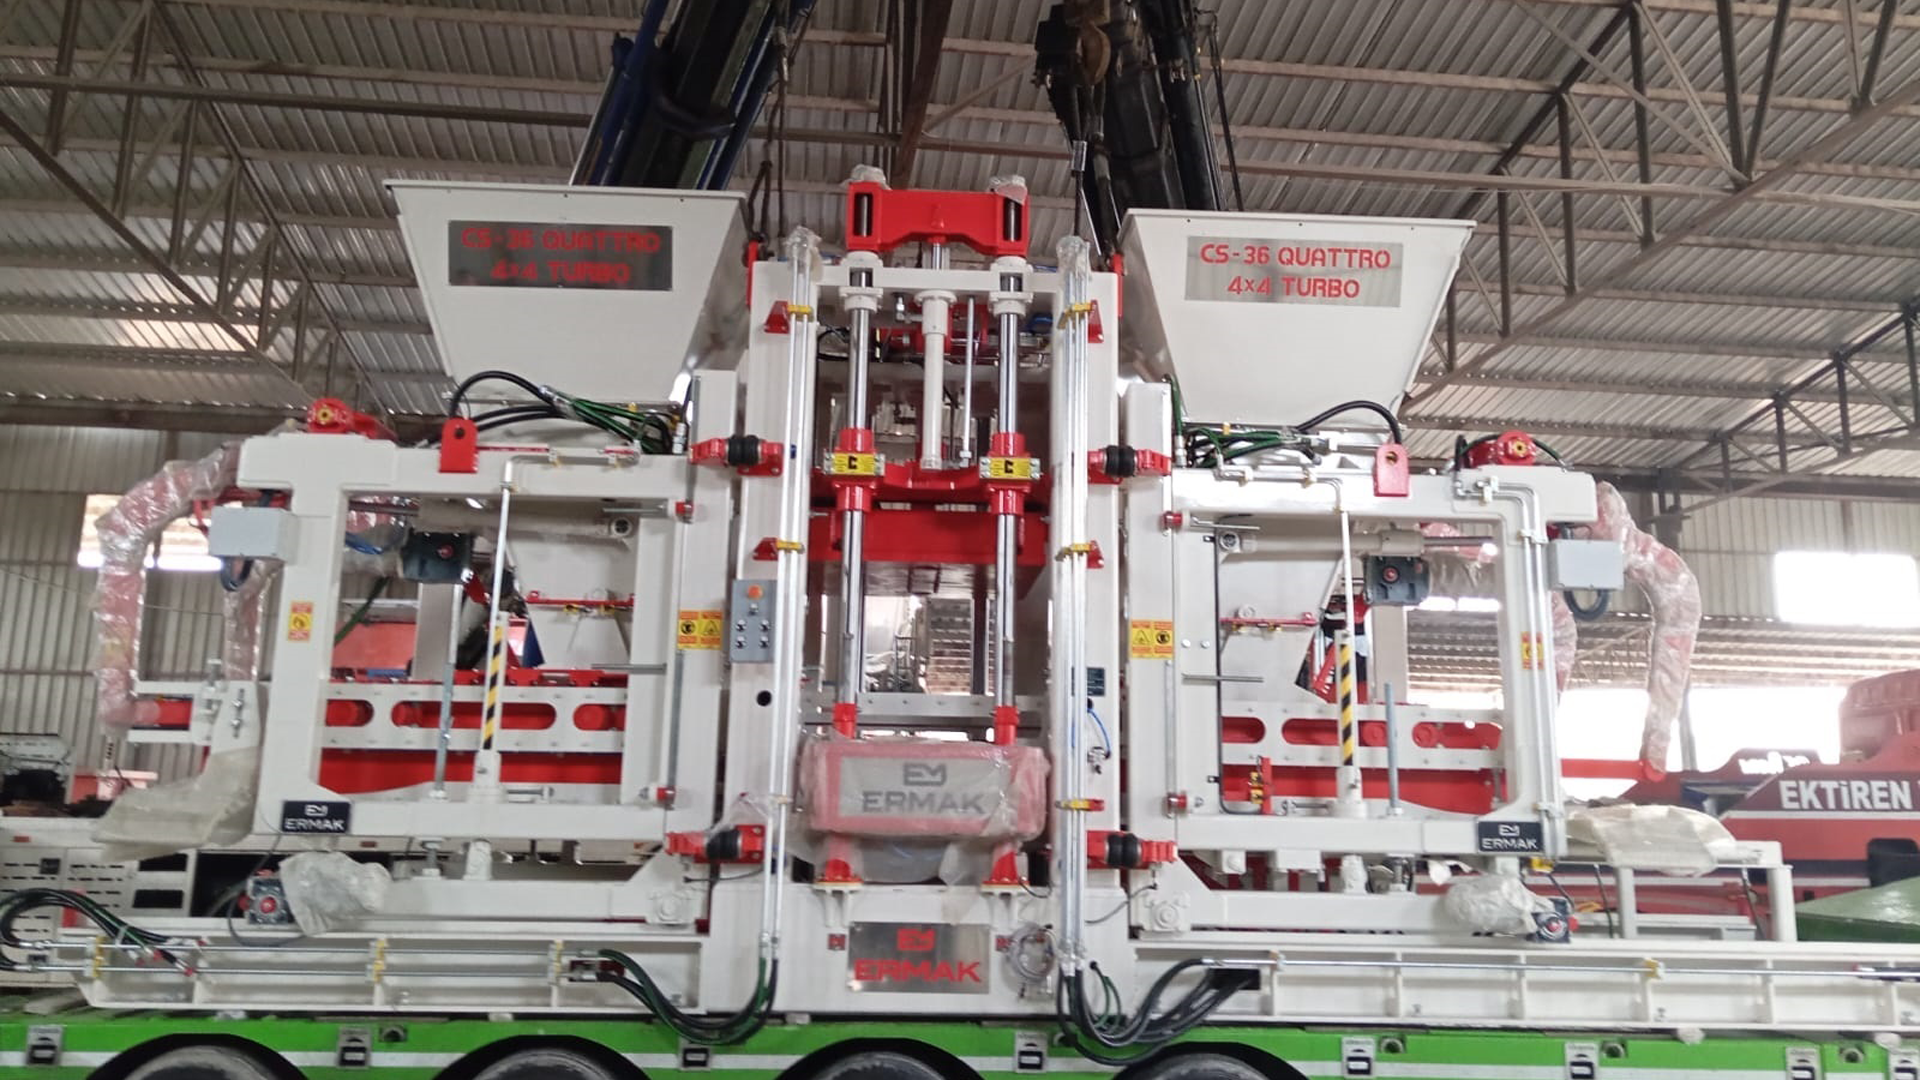
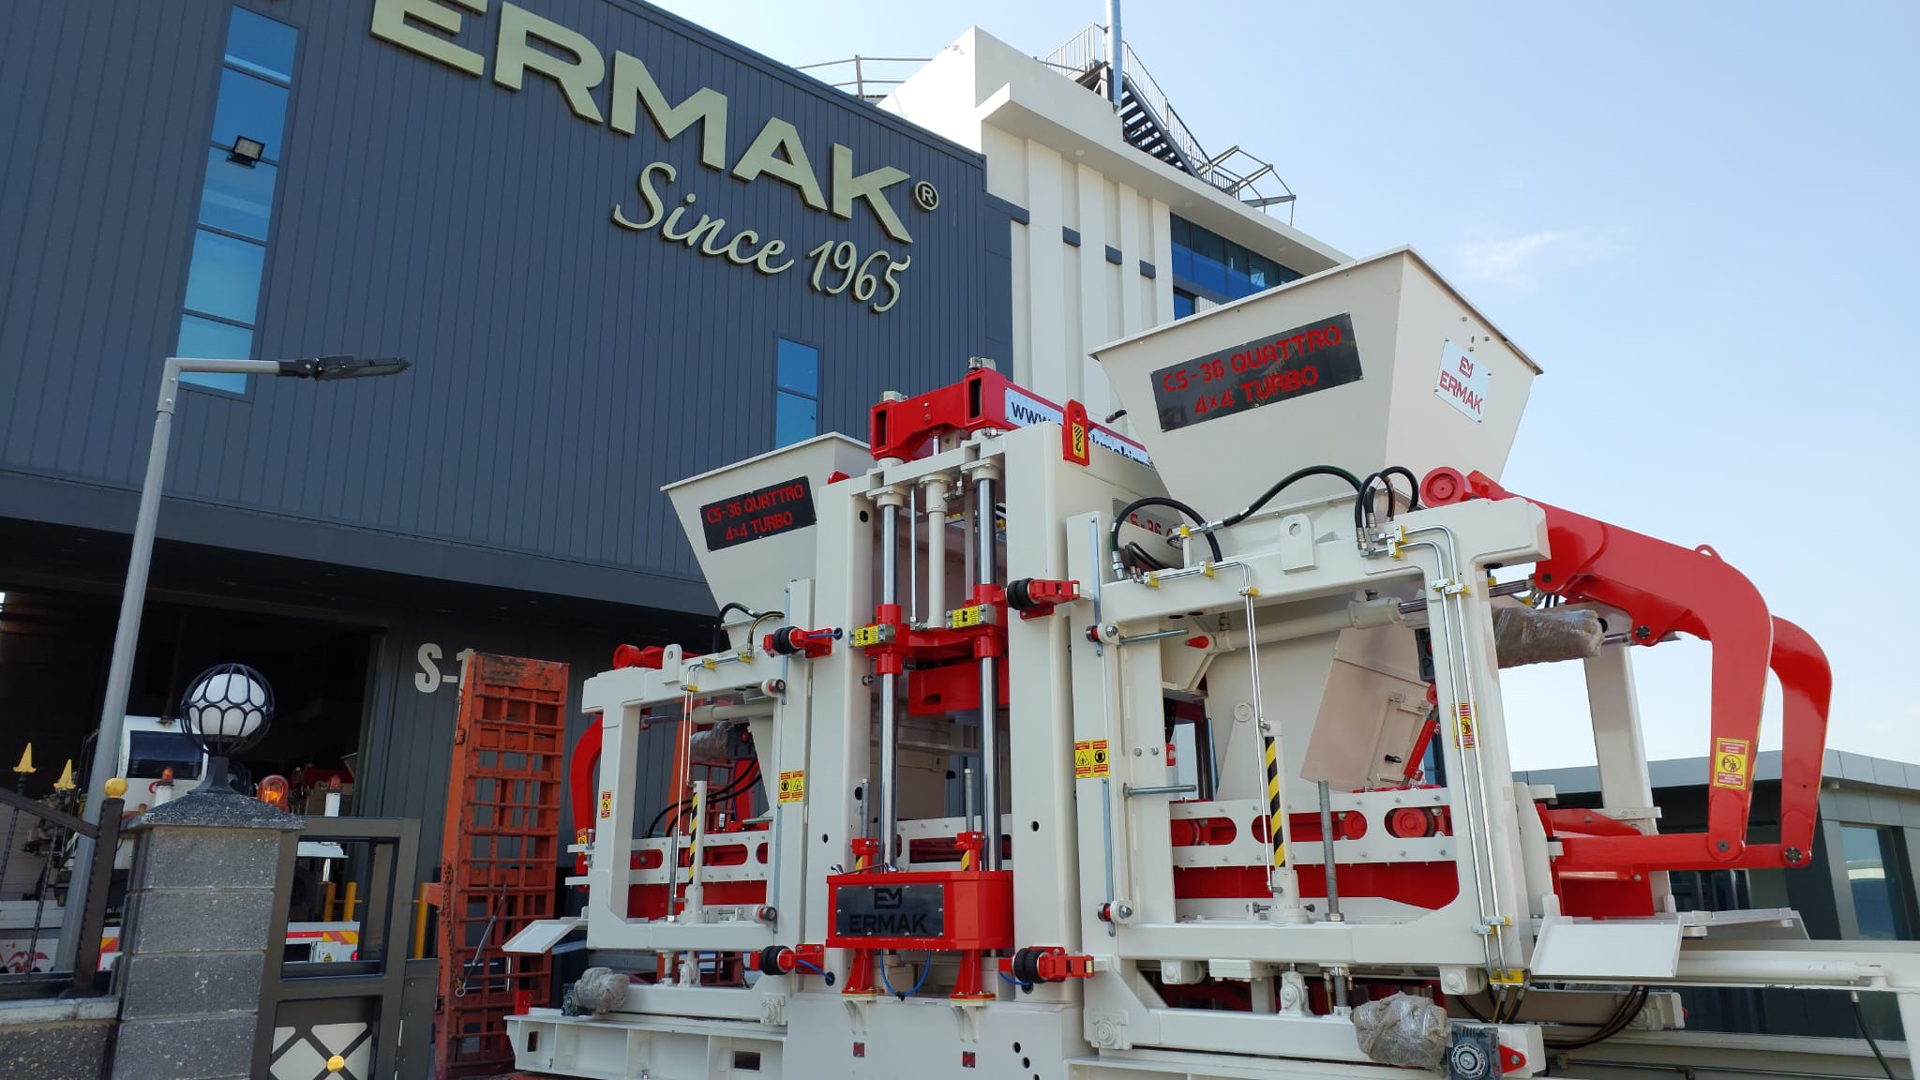
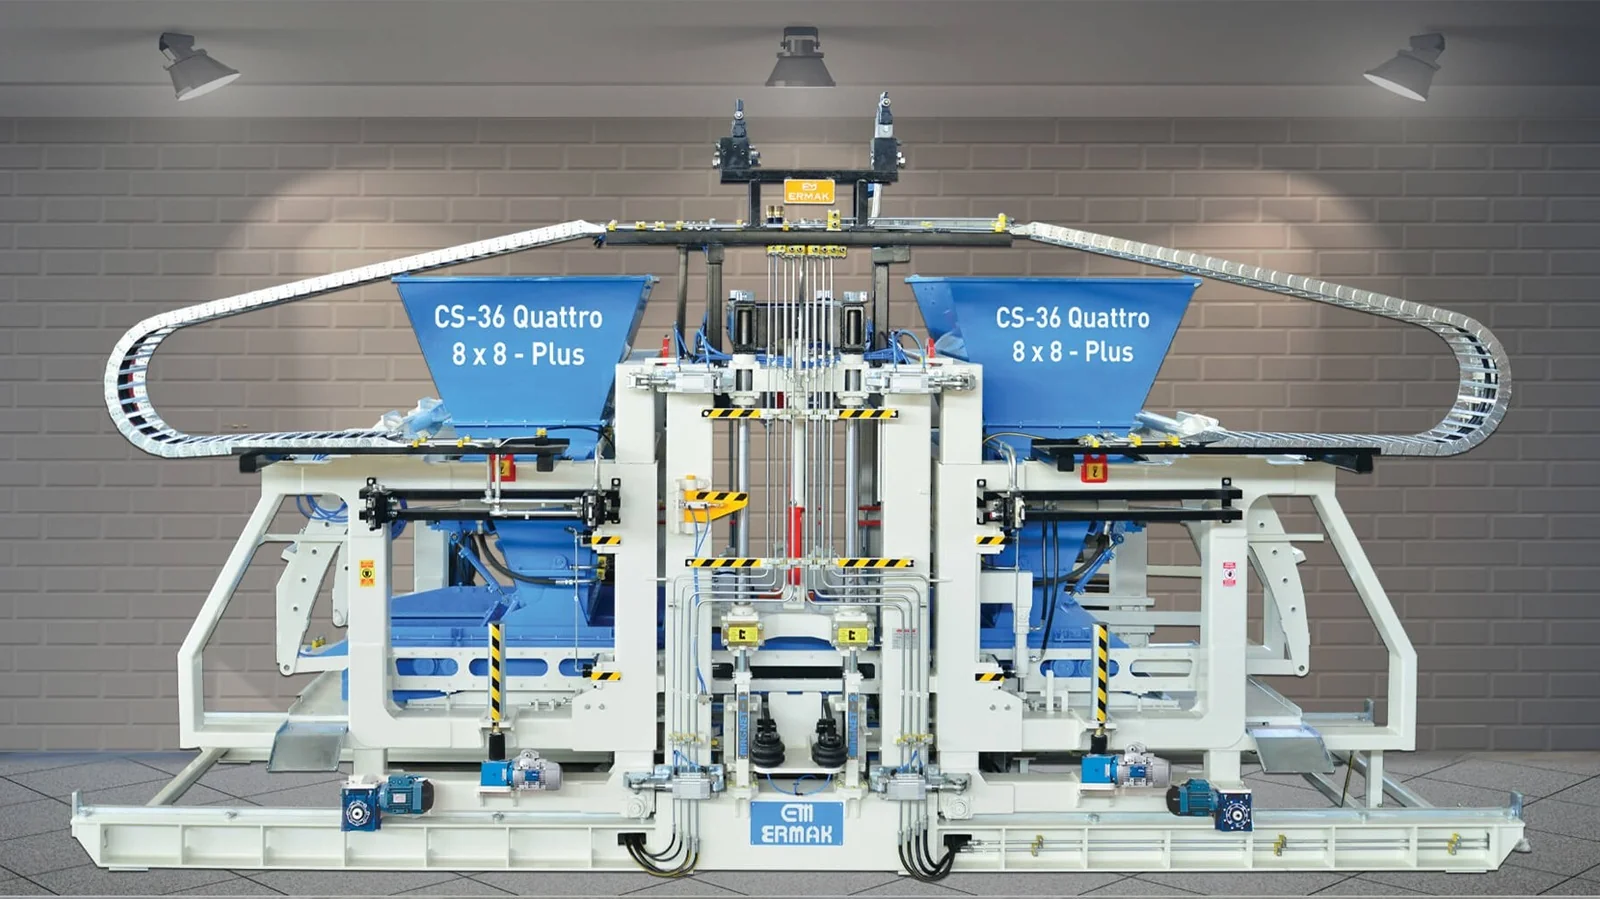
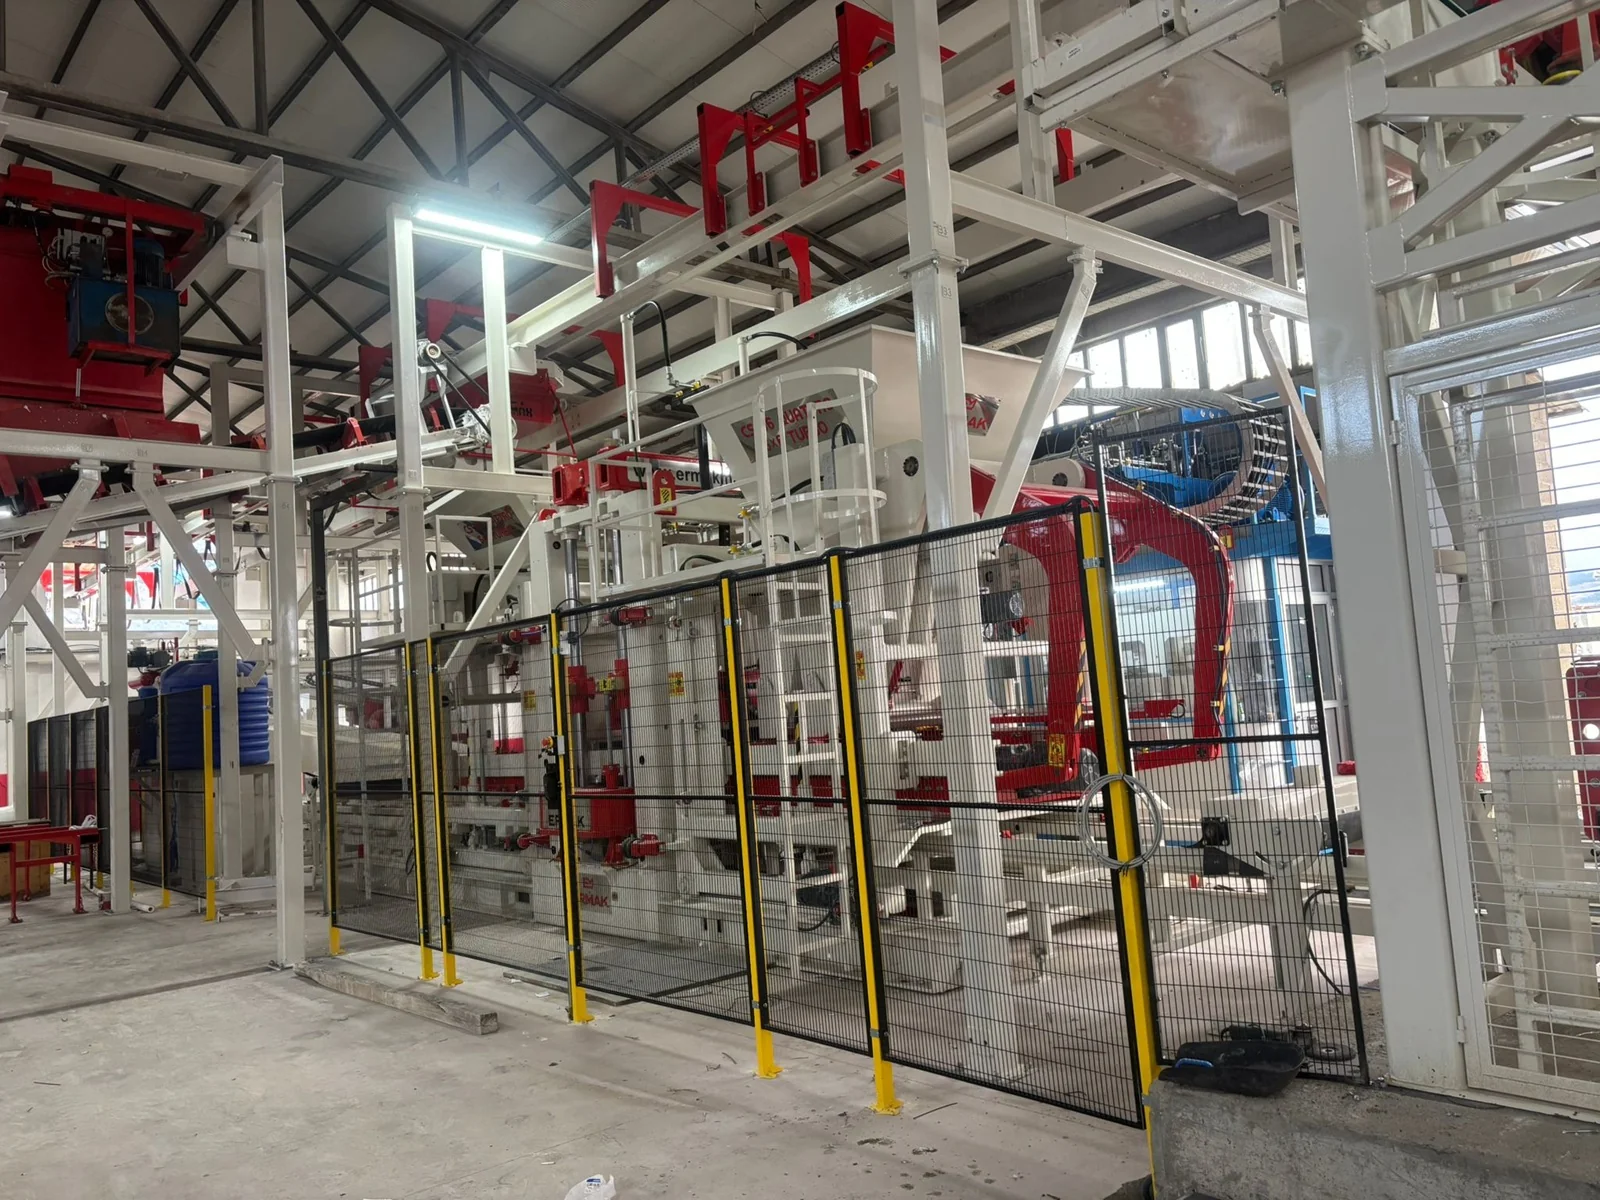
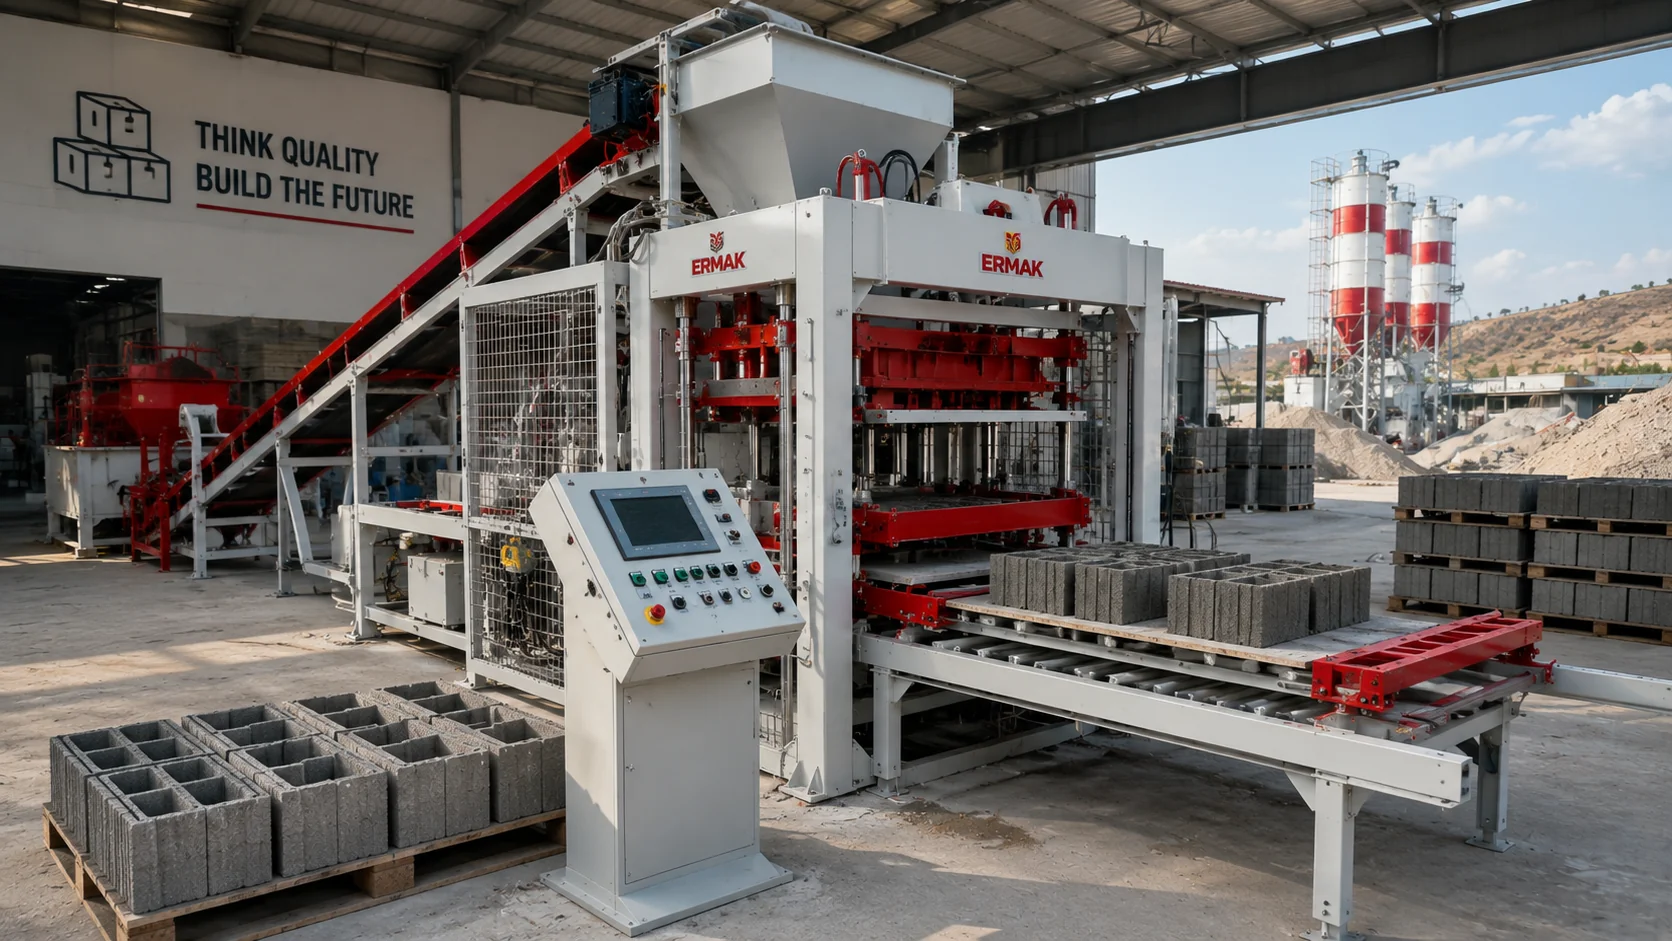
A concrete block machine may have an impressive theoretical production capacity, but the number shown in a technical brochure does not automatically represent what the factory will achieve in daily operation. Real production includes mould changes, concrete waiting, short stops, maintenance, operator interventions, dry-side delays and rejected products. This is why plant managers need a performance indicator that measures how effectively planned production time is converted into saleable output.
Overall Equipment Effectiveness, commonly known as OEE, is one of the most useful tools for this purpose. OEE combines three factors—Availability, Performance and Quality—into a single percentage that helps manufacturers understand where production capacity is being lost. More importantly, it helps separate different types of losses so the plant can improve the correct area rather than simply pushing the main machine to run faster.
What Does OEE Measure?
OEE measures how efficiently a production asset or production line uses its planned operating time. It does not simply ask whether the machine is running. It asks whether the machine is available when it should be, whether it is producing at the expected speed and whether the products being produced are acceptable for sale.
The basic formula is:
OEE = Availability × Performance × Quality
Each factor is expressed as a percentage. A machine with high availability but poor product quality can still have weak OEE. Similarly, a machine producing good products may have low OEE if it spends too much time waiting for concrete or experiencing frequent short stops. This is what makes OEE more useful than looking only at daily production quantity.
Availability Measures Whether the Plant Is Running
Availability measures how much of the planned production time is actually used for running. If a factory plans to operate for eight hours but the machine loses one hour due to breakdowns, waiting or unplanned intervention, availability decreases.
The simplified formula is:
Availability = Operating Time / Planned Production Time
For example, if a shift provides 480 minutes of planned production time and the plant loses 60 minutes to unplanned stops, operating time becomes 420 minutes. Availability would then be 420 divided by 480, or 87.5%.
The important point is to define planned production time consistently. Scheduled maintenance, planned breaks and other agreed non-production periods may be treated differently depending on the company’s OEE methodology. What matters is using the same definitions over time so trends remain meaningful.
Main Machine Downtime Is Only Part of Availability Loss
In a concrete block plant, downtime should not automatically be blamed on the main machine. The block machine may be mechanically ready but unable to run because another section is unavailable.
Concrete preparation may be late. The mixer may be stopped. Production pallets may not return from the dry side. Curing capacity may be full, or the cubing system may have a fault. All of these situations can reduce the availability of the complete production line even if the main machine itself has no failure.
For this reason, plants should record not only how long production stopped but also why it stopped. A simple list of stop categories can reveal whether the real problem lies in the main machine, batching plant, dry side, maintenance, labour or material supply.
Planned and Unplanned Stops Should Be Separated
Not every stop represents the same type of loss. A planned mould change is different from an unexpected hydraulic failure, and preventive maintenance is different from a sensor fault during normal production.
Separating planned and unplanned stops helps management understand which losses can realistically be reduced. Planned mould changes may be optimized through better preparation and faster procedures, while unplanned breakdowns may require maintenance or engineering action.
If all downtime is grouped into one category, the OEE number may be correct mathematically but not very useful operationally.
Mould Change Time Can Have a Large Effect on Availability
Factories producing multiple block, paver and kerbstone types may perform frequent mould changes. Each change reduces available production time, especially if the process involves long mechanical adjustments or extensive parameter setup.
The best way to manage this is not to avoid product variety but to measure changeover time separately and improve repeatability. Tools can be prepared in advance, moulds can be stored logically and production recipes can be saved in the PLC and HMI.
A reduction of 10 or 15 minutes per mould change can create significant additional production time over a year if changes occur frequently.
Performance Measures How Fast the Plant Is Producing
Performance compares actual production speed with the expected or ideal production speed. A plant can be available and running but still lose output because the cycle is slower than planned.
A simplified performance formula is:
Performance = Ideal Cycle Time × Total Production / Operating Time
For concrete block production, the ideal cycle time should be connected to a clearly defined product. A paving stone, hollow block and kerbstone may require different production times, so using one fixed ideal cycle across all products can create misleading OEE results.
Performance measurement becomes much more useful when each product or product family has its own realistic reference cycle.
The Ideal Cycle Should Be Realistic
An unrealistic ideal cycle can make every shift appear inefficient. If the reference is based on the fastest cycle ever achieved during a short test, normal production may always seem below target.
The better approach is to define a technically sustainable cycle that can be maintained while producing acceptable product quality. This reference can then be reviewed periodically as the plant improves.
The objective of OEE is not to create a permanently low score. It is to provide a useful benchmark that identifies genuine production losses.
Micro-Stops Can Reduce Performance Without Looking Like Downtime
One of the most overlooked sources of lost production is the micro-stop. These are short interruptions that may last only a few seconds or minutes and often do not appear in manual downtime reports.
A pallet sensor may need adjustment. Concrete may arrive slightly late. An operator may pause the machine for a quick visual check. The dry side may hesitate before releasing the next pallet. Individually, these events seem insignificant, but repeated hundreds of times they can create major performance loss.
Automatic production data from PLC and HMI systems can make these losses visible. Without this data, managers may see a machine that was “running all day” and still fail to understand why output was below target.
Slow Cycles Should Be Investigated by Product
If the machine is running slower than expected, the cause should be analysed at product level. A complex decorative paver may naturally require more filling or vibration time than a standard hollow block.
This is why cycle-time analysis should not compare unrelated products. Each product should have its own reference range and production recipe.
If the same product becomes gradually slower over several weeks, the plant can investigate concrete behaviour, mould condition, hydraulic movement, vibration settings or feeding performance. Performance trends often reveal developing problems before they cause a complete breakdown.
Performance Should Not Be Improved by Sacrificing Quality
A common mistake is to reduce cycle time aggressively to increase the performance component of OEE. If this creates poorly compacted products, weak edges or dimensional variation, the quality component falls and the plant gains little economically.
The objective is not to maximize one part of OEE. The objective is to improve the total amount of saleable product produced during planned operating time.
In practical terms, a slightly longer cycle that produces stable quality can be more profitable than a faster cycle that creates higher reject rates.
Quality Measures Saleable Production
The quality component of OEE compares acceptable products with total production.
A simplified formula is:
Quality = Good Production / Total Production
If a factory produces 20,000 blocks during a shift but 1,000 are rejected, the quality rate is 95%. Those rejected products consumed concrete, electricity, machine time and labour but generated no saleable output.
This is why quality loss has a direct financial effect even when the main machine appears productive.
Rejects Should Be Categorized by Cause
Recording only the total number of rejected products is not enough. The factory should identify the main causes whenever possible.
Common categories may include dimensional variation, poor compaction, broken corners, surface defects, incorrect colour, handling damage or packaging damage. These categories can then be connected with production conditions such as product type, mould, shift and machine settings.
Over time, patterns become visible. If the same mould repeatedly creates dimensional rejects, the issue may lie in mould wear rather than the main machine. If defects increase during certain raw-material conditions, the concrete process may require attention.
Saleable Output Is More Important Than Gross Production
OEE helps shift management attention from gross machine cycles to real commercial output. A factory can produce many units and still perform poorly if a large percentage requires rework or becomes scrap.
This distinction is especially important when comparing machines or shifts. The strongest result is not necessarily the shift with the highest raw production count. It is the one that converts the largest proportion of available production time into acceptable products.
For high-capacity systems such as the Quattro 8X8 Plus concrete block machine, even small improvements in quality or uptime can represent a significant number of additional saleable units over a full year.
A Simple OEE Example
Consider a plant with 480 minutes of planned production time. During the shift, 60 minutes are lost to unplanned stops, leaving 420 minutes of operating time. Availability is therefore 87.5%.
Assume the machine’s sustainable reference cycle for the selected product indicates that 22,000 units should have been produced during those 420 minutes, but actual output was 20,000 units. Performance would be approximately 90.9%.
If 19,000 of the 20,000 produced units are acceptable, the quality rate is 95%.
The resulting OEE would be:
0.875 × 0.909 × 0.95 = approximately 75.5%
This percentage by itself is less important than understanding why the remaining performance was lost.
There Is No Universal “Good OEE” Number for Every Block Plant
OEE benchmarks can be useful, but they should be treated carefully. Different product mixes, automation levels, plant ages and operating strategies make direct comparisons difficult.
A factory producing one standard block continuously has a different operating environment from a plant changing moulds frequently and producing several premium paver types. Comparing both plants using one universal OEE target can lead to poor decisions.
The most useful benchmark is often the factory’s own historical performance. If OEE improves from 62% to 70% while product quality remains stable, the plant has created a measurable improvement regardless of whether another factory reports a higher figure.
Track the Trend, Not Just the Daily Score
Daily OEE can vary because of product changes, maintenance or unusual production conditions. Management should therefore look at weekly and monthly trends in addition to individual shifts.
A gradual decline in availability may indicate increasing maintenance issues. A reduction in performance could reveal slower cycles or growing micro-stops, while declining quality may point to mould wear or process instability.
Trend analysis gives OEE strategic value. Instead of reacting only to major failures, the plant can identify changes while they are still relatively small.
Machine OEE and Plant OEE Are Not the Same
The main block machine may have strong OEE while the complete factory performs poorly. This happens when bottlenecks exist outside the machine.
For example, the block machine may run efficiently whenever it receives concrete, but the batching plant may repeatedly delay supply. If OEE is measured only during periods when the main machine is free to run, the result can hide the real plant loss.
Factories should therefore decide whether they are measuring individual equipment OEE, line OEE or complete plant performance. Each metric answers a different question.
The Bottleneck Determines Where Improvement Matters Most
A factory should not automatically improve the machine with the lowest OEE. The true objective is to increase the output of the complete system.
If the main machine has unused capacity because the dry side cannot keep up, making the main machine even faster creates no benefit. In that situation, the cubing or packaging section is the real improvement target.
OEE data should therefore be combined with bottleneck analysis. This helps management spend money where it can actually increase plant output.
Stop Codes Make OEE More Useful
A practical OEE system should include clear stop codes. These might include batching delay, mixer fault, main machine mechanical fault, hydraulic fault, sensor issue, mould change, cleaning, curing delay, dry-side stop, packaging stop or lack of production pallets.
The list should be detailed enough to support analysis but not so complicated that operators avoid using it. If there are hundreds of codes, data quality may become poor.
A simple, disciplined stop-code structure usually provides better information than an overly complex system.
Operators Should Not Feel That OEE Is a Personal Score
If operators believe OEE is being used to judge or punish them individually, data quality often becomes worse. Small stops may go unreported, reject numbers may be minimized and the system loses credibility.
OEE should be presented as a process-improvement tool. The goal is to identify machine, material and workflow losses rather than assign blame.
Operators often have the best understanding of recurring production problems, so their participation can improve both data quality and problem solving.
Automatic Data Collection Improves Accuracy
Manual spreadsheets can be useful when a plant first starts tracking OEE, but automatic data collection can significantly improve accuracy. PLC and HMI systems can record machine states, cycle times, alarms and stop durations directly.
This reduces the risk of forgetting short stops and provides more detailed time-based analysis. Quality data may still require operator or quality-control input, depending on the plant.
The best system is not necessarily the most complex software package. It is the system that reliably captures the information required to make production decisions.
OEE Can Reveal Energy Waste
OEE is primarily a production-efficiency metric, but it can also help identify energy inefficiency. A plant with long idle periods may continue consuming electricity through hydraulic systems, conveyors, compressors or auxiliary equipment while producing no saleable product.
By combining OEE with energy data, the factory can calculate energy per thousand blocks or per square metre of pavers. This creates a clearer picture of operating efficiency.
Improving availability and performance can therefore reduce not only lost production time but also energy consumption per saleable unit.
Raw-Material Efficiency Can Also Be Connected with OEE
Rejected products represent wasted cement, aggregate, pigment and other materials. A higher quality rate means more of the purchased raw material becomes saleable product.
This is especially important in large factories where even a small reject reduction can represent significant annual cement and aggregate savings.
OEE can therefore support broader cost analysis when combined with production and material-consumption data.
Mould Condition Can Affect All Three OEE Factors
Mould problems can reduce availability through longer changeovers or unexpected maintenance. They can reduce performance if operators need slower filling or vibration settings, and they can reduce quality through dimensional rejects.
This makes mould condition a good example of why OEE losses should be analysed systematically. A single underlying problem can affect several metrics at the same time.
Tracking performance by mould can help identify which moulds are creating repeated production losses.
Preventive Maintenance Can Improve Availability
Unplanned breakdowns are one of the clearest causes of availability loss. Preventive maintenance aims to reduce these stops by inspecting and servicing equipment before failure.
However, simply increasing maintenance frequency does not automatically improve OEE. Maintenance should focus on components and conditions that create real production risk.
Alarm history, stop data and recurring fault information can help maintenance teams prioritize the most important areas.
Predictable Maintenance Is Better Than Emergency Maintenance
When the plant understands typical wear patterns, components can often be replaced during planned stops instead of failing during production. This converts unplanned downtime into controlled maintenance.
The difference is economically important because planned work can be coordinated with mould changes, weekends or other non-production periods.
OEE data helps identify where this strategy can create the largest benefit.
Changeover Time Should Be Tracked as Its Own KPI
For multi-product plants, mould change and product setup can represent a significant portion of lost production time. Tracking changeover time separately makes improvement easier.
The factory can measure the time from the last acceptable product of one production run to the first acceptable product of the next. This includes physical mould change, recipe loading and production stabilization.
Reducing this interval can increase availability without purchasing a faster machine.
Shift-Level Analysis Can Identify Process Differences
Comparing OEE between shifts can reveal useful patterns, but the analysis should remain fair. Different shifts may produce different products or face different maintenance and material conditions.
If the same product is repeatedly stronger on one shift, the factory can investigate operating practices and share successful methods. The purpose should be standardization, not competition between teams.
Consistent processes across shifts reduce dependence on individual operator experience.
Product-Level OEE Provides Better Insight
A single monthly OEE figure can hide large differences between products. Standard blocks may run efficiently while one complex decorative paver creates frequent stops and high rejects.
Tracking OEE by product family helps the factory understand the true manufacturing cost and difficulty of each product.
This information can also support pricing decisions. A product that sells at a premium but consumes significantly more machine time may not be as profitable as expected unless its selling price reflects that complexity.
OEE Helps Evaluate Capacity Before Buying Another Machine
When demand increases, management may assume that another block machine is required. OEE data can show whether the existing plant is actually using its current capacity effectively.
If OEE is low because of avoidable downtime, slow changeovers or packaging bottlenecks, improving the existing line may create additional output at much lower cost than purchasing another main machine.
Only after current losses are understood should major capacity expansion be evaluated.
OEE Is Useful During New Plant Commissioning
OEE can also help after a new production line is commissioned. Initial performance is unlikely to reach the long-term target immediately because operators are learning, recipes are being optimized and process problems are still being corrected.
Tracking availability, performance and quality separately helps the team see where stabilization is progressing and where further engineering work is required.
The first objective should not be reaching a perfect OEE percentage. It should be building a stable baseline and improving it systematically.
OEE Should Support Root-Cause Analysis
OEE tells the plant where capacity is being lost, but it does not automatically explain why. A low availability value shows there is too much downtime, but the plant still needs to investigate the cause.
The same applies to performance and quality losses. OEE should therefore be connected with root-cause tools, maintenance analysis and production observations.
The strongest improvement process follows a simple sequence: measure the loss, identify the main cause, implement an improvement and then verify whether the metric changes.
Small Improvements Can Create Large Annual Gains
A one-percent OEE improvement may sound insignificant, but the economic effect can be substantial in a high-capacity plant operating thousands of hours per year.
If the improvement comes from reduced downtime, the plant gains additional productive minutes. If it comes from quality, more existing production becomes saleable. If it comes from performance, more products are produced during the same available time.
The value should therefore be calculated using annual production volume rather than judging the percentage alone.
OEE Should Be Connected with Total Cost of Ownership
OEE and Total Cost of Ownership are closely related. Low availability increases downtime cost, poor performance raises cost per unit and low quality wastes raw materials and machine time.
Two machines with similar purchase prices can therefore have very different long-term economics if their OEE performance differs significantly.
For buyers evaluating new equipment, expected maintainability, changeover time, automation, spare parts and complete-line balance should all be considered because these factors influence future OEE.
Complete-Line Design Creates the Foundation for High OEE
OEE cannot correct a production line that was poorly balanced from the beginning. If the mixer is too small, curing capacity is insufficient or the dry side cannot match the main machine, recurring losses will remain built into the plant.
This is why complete-line engineering is critical. The batching plant, main machine, curing system, production pallet flow, cubing and packaging should all be designed around the same realistic production target.
Investors evaluating different capacities and plant configurations can review the Ermak Makine concrete block and production line catalogs when planning how the main machine and auxiliary systems should work together.
Ermak Makine’s Approach to Real Plant Performance
At Ermak Makine, we consider machine capacity as only one part of plant performance. A machine should not simply be capable of producing quickly under ideal conditions; the complete line should support stable output under real operating conditions.
For this reason, production planning needs to consider batching, mould changes, automation, curing, dry-side flow, maintenance and quality together. OEE provides a useful way to convert these operational factors into measurable production information.
The objective is not to chase one high percentage. It is to identify where saleable production is being lost and improve those losses in a controlled way.
Companies planning a new block, paver or kerbstone production plant can contact Ermak Makine to discuss target capacity, product range and complete plant configuration.
What Does Good OEE Management Look Like?
Good OEE management begins with reliable data and clear definitions. Planned production time, stop reasons, ideal cycle times and quality criteria should be defined consistently. The plant should then analyse availability, performance and quality separately instead of focusing only on the final percentage.
The most useful OEE system is one that leads to action. If the data shows recurring dry-side stops, management should investigate the dry side. If one mould creates higher rejects, mould condition should be reviewed. If cycle time gradually increases, production settings and machine condition should be checked.
For concrete block manufacturers, OEE becomes valuable when it moves the discussion from theoretical machine capacity to real saleable production achieved from the time, equipment, energy and materials already available in the factory.
Frequently Asked Questions
What does OEE stand for?
OEE stands for Overall Equipment Effectiveness. It measures how effectively planned production time is converted into acceptable output.
What are the three parts of OEE?
OEE consists of Availability, Performance and Quality.
How is OEE calculated?
OEE is calculated by multiplying Availability × Performance × Quality.
What does Availability measure?
Availability measures how much of planned production time the equipment or production line is actually running.
What does Performance measure?
Performance compares actual production speed with the defined ideal or sustainable production speed.
What does Quality measure?
Quality measures the proportion of produced units that meet the required acceptance criteria and are considered good output.
Should one ideal cycle time be used for every product?
No. Different blocks, pavers and kerbstones may require different sustainable cycle times, so product-specific references are more accurate.
Do mould changes reduce OEE?
They can reduce availability during planned production time. Tracking changeover time separately helps identify opportunities for improvement.
What are micro-stops?
Micro-stops are short interruptions that may last only seconds or minutes. Repeated frequently, they can create significant production loss.
Is high machine OEE enough for a high-performing plant?
No. Batching, curing, dry-side handling and packaging can still limit complete plant performance.
What is a good OEE percentage for a concrete block plant?
There is no single value that applies to every factory. Product mix, automation, plant age and operating strategy differ, so internal trends and improvement are often more useful than universal benchmarks.
Can OEE help reduce energy cost?
Indirectly, yes. Higher availability and performance can reduce idle energy consumption and lower energy cost per saleable product.
Can mould wear affect OEE?
Yes. Mould problems can increase downtime, slow production and create quality rejects, affecting all three OEE components.
Should OEE be tracked by product?
Where practical, yes. Product-level OEE can reveal which products create more downtime, slower cycles or higher quality losses.
What is the most important purpose of OEE in concrete block production?
The most important purpose is to identify where real production capacity is being lost so the plant can improve saleable output instead of relying only on theoretical machine capacity.